Up to this point, we have been working with source data from one table. In reality, users will most likely encounter data from disparate data source. Start from the basic again, in the following example we are working with data source from two tables within the same worksheet:
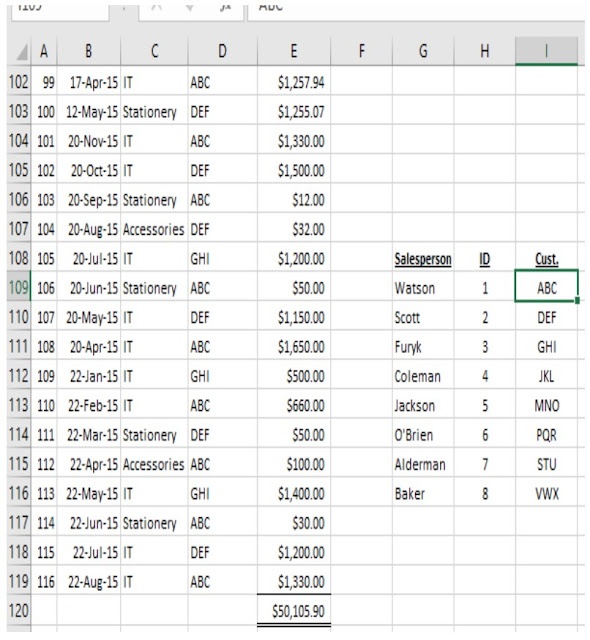
The table on the left is a Sales summary, and the one on the right is a Salesperson table, we want to group them together to find out the performance of the salespersons.
First, we need to tell Excel their relationship, and then pull them into the internal Data Model.
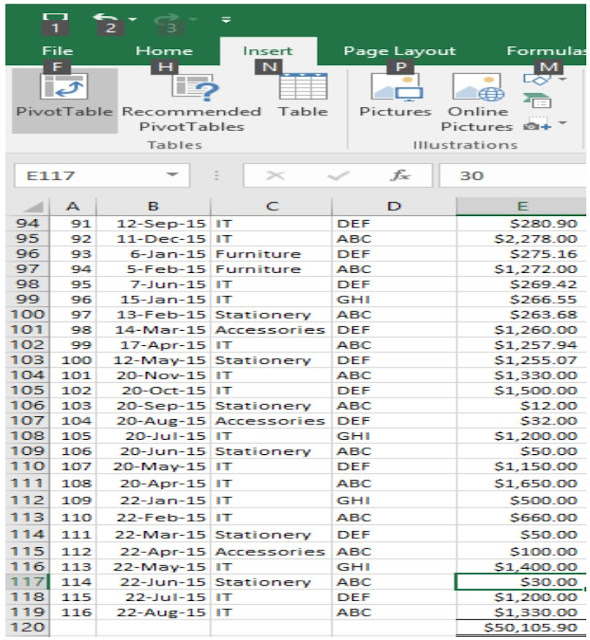
 Step 1: Click any cell of the Sales Summary table.
Step 2: Go to ribbon, select "Insert"
Step 3: Select "Pivot Table"
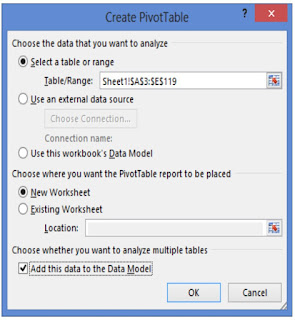
Step 4: "Create Pivot Table" dialog box will pop up
Step 5: Select and check the range, select "New Worksheet"
Step 6: Be sure to check next to the "Add this data to the Data Model" => OK
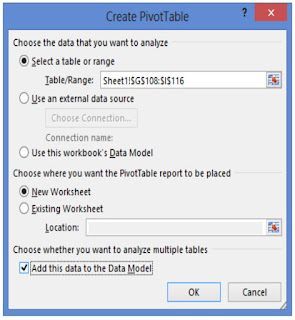 Step 7: Click any cell inside the Salesperson table
Step 8: Repeat the procedure (Step 2 to 5) for the Salesperson table.
Step 9: On the "Create Pivot Table" dialog box, also check the box next to the "Add this data to the Data Model"
Underneath the "Pivot Table Fields", we can see there's an "Active" and "All" , we select "All".
"Range" and "Range 1" is the two tables of our source data.
We can click the arrowhead to the left of "Range" and "Range 1" and select fields to incorporate into our new Pivot Table.
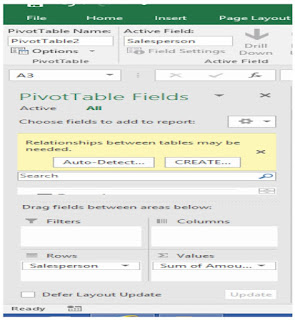 We select "Salesperson" to Rows and "Amounts" to Values.
Excel recognises that we are using two tables from our Data Model, and prompts us to create a relationship between them.
To set up the relationship, we click "CREATE"
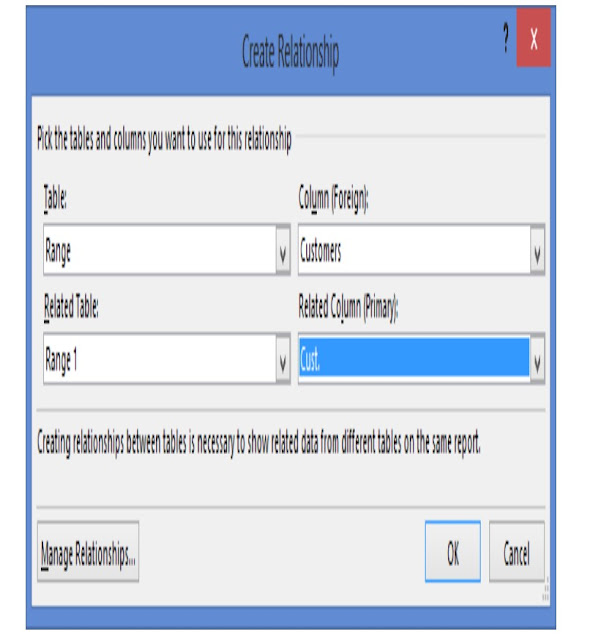
This is the crucial part, we have to let Excel know the relationship between the two tables, then Excel will base on this relationship to build up the Pivot table. In our example, their relationship is linked by the customers, which is also the common attributes in both tables.
Therefore, we linked up the "Customers" from Sales summary table to the "Cust." in the Salesperson table as shown in the "Create Relationship" dialog box per above.
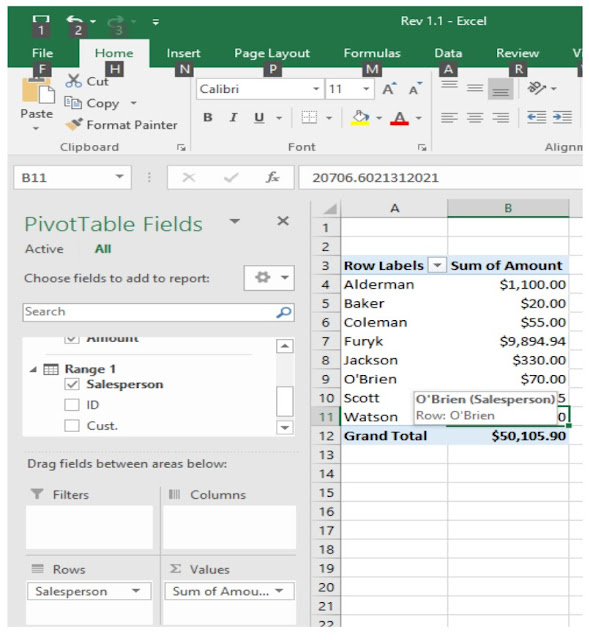
Following is the resulting Pivot table:

No comments:
Post a Comment